
Barbara Wright
User Experience Research
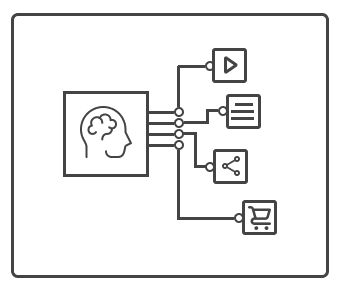
Powered by User Insights
Through insightful research, I uncover the stories that inspire exceptional design.
About
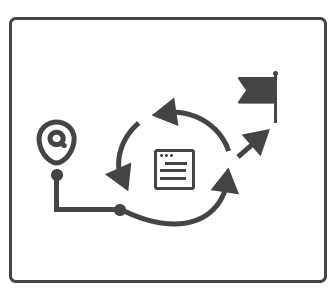
As an empathetic advocate for people who interact with computers, I use intuitive listening and deep analysis to find research backed solutions that meet business needs while creating excellent experiences.
Storytelling and effective communication are my cornerstones for working with cross-functional teams. Working independently and with fast-paced agile teams, my background in web production and design thinking enables me to understand a broader picture of digital products.

✓ Collaborative
✓ Creative
✓ Reliable
✓ Efficient
Barbara Wright
[email protected]
LinkedIn
© Copyright 2025. All rights reserved.